Example gallery
Below, you will find some examples of the usage of psynlig.
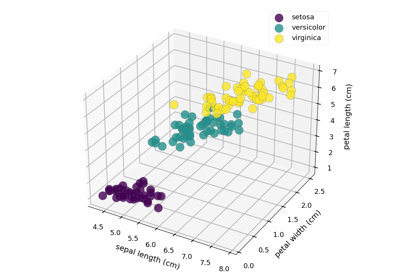
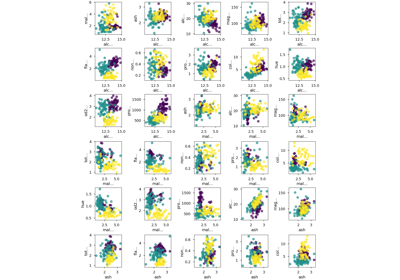
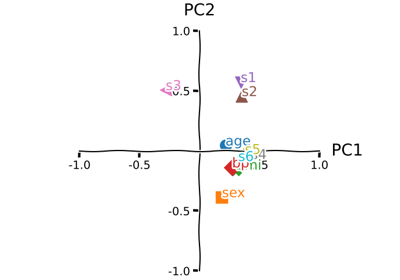
Data exploration
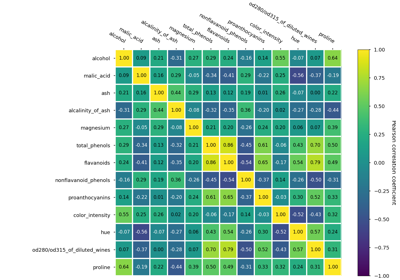
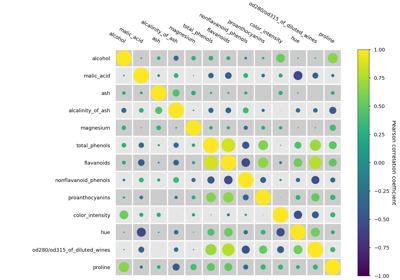
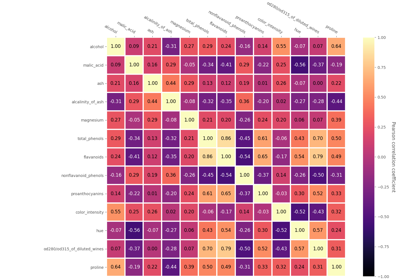
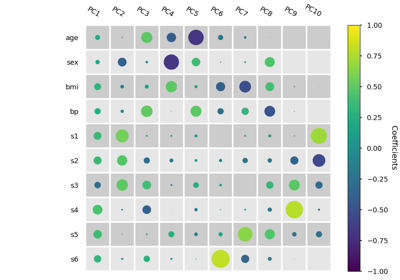
Generating a heat map of correlations (bubble version)
Generating a heat map of correlations (bubble version)
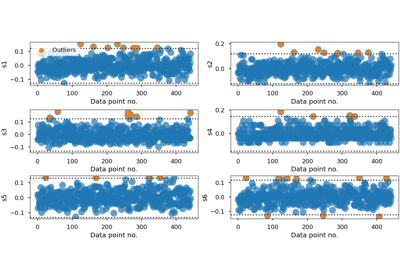
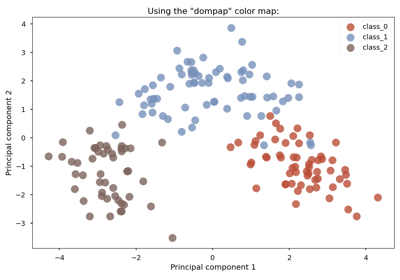
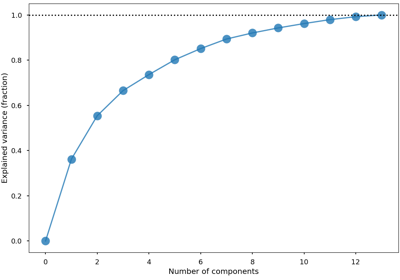
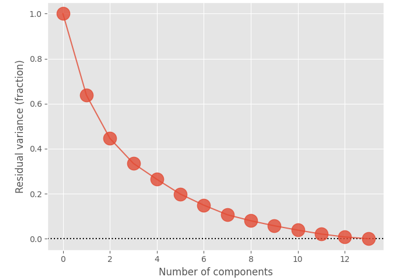
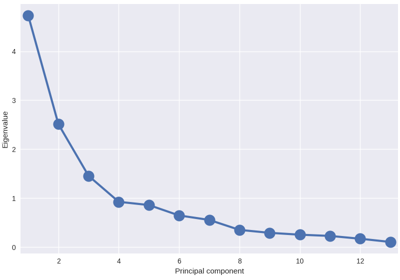
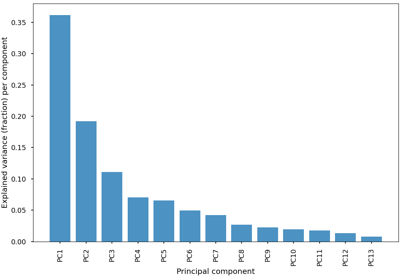
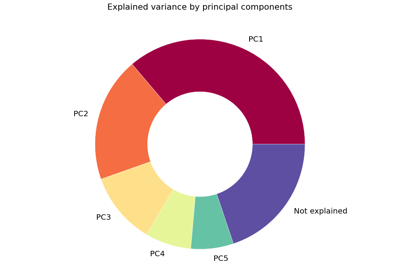
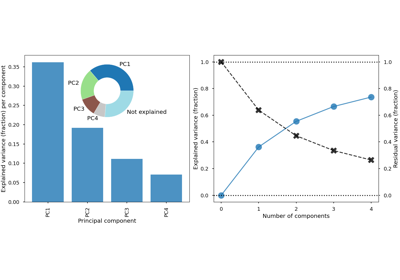
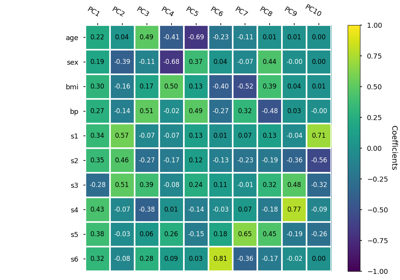
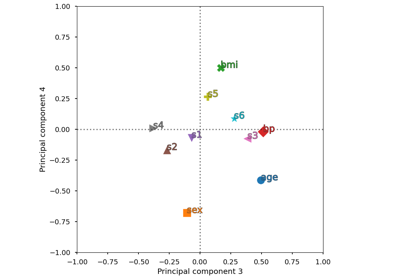
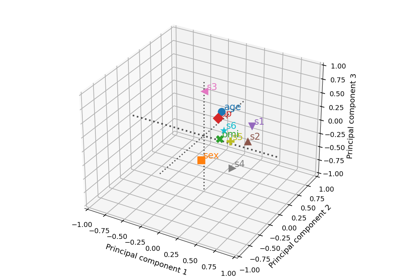
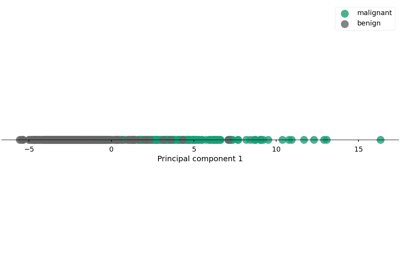
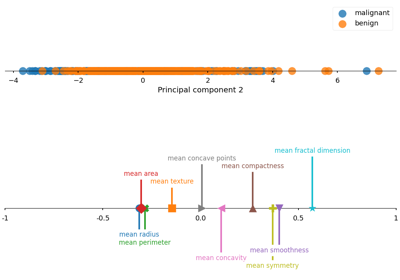
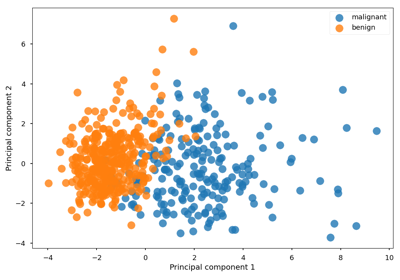
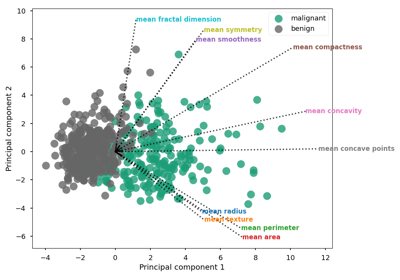
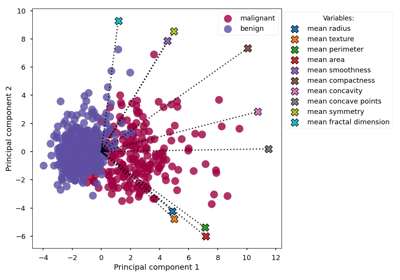
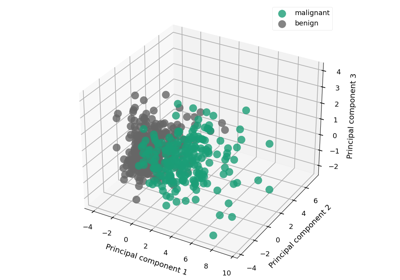
Principal component analysis
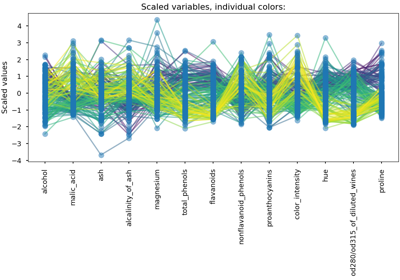
Changing the style of plots
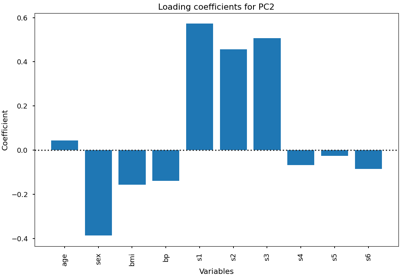
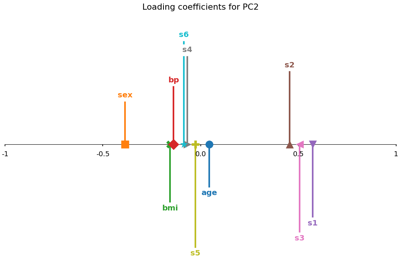
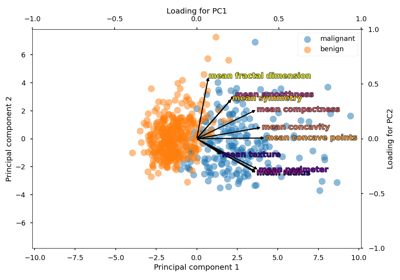
PCA Loadings (2D) with xkcd style and centered axes
PCA Loadings (2D) with xkcd style and centered axes