Note
Go to the end to download the full example code
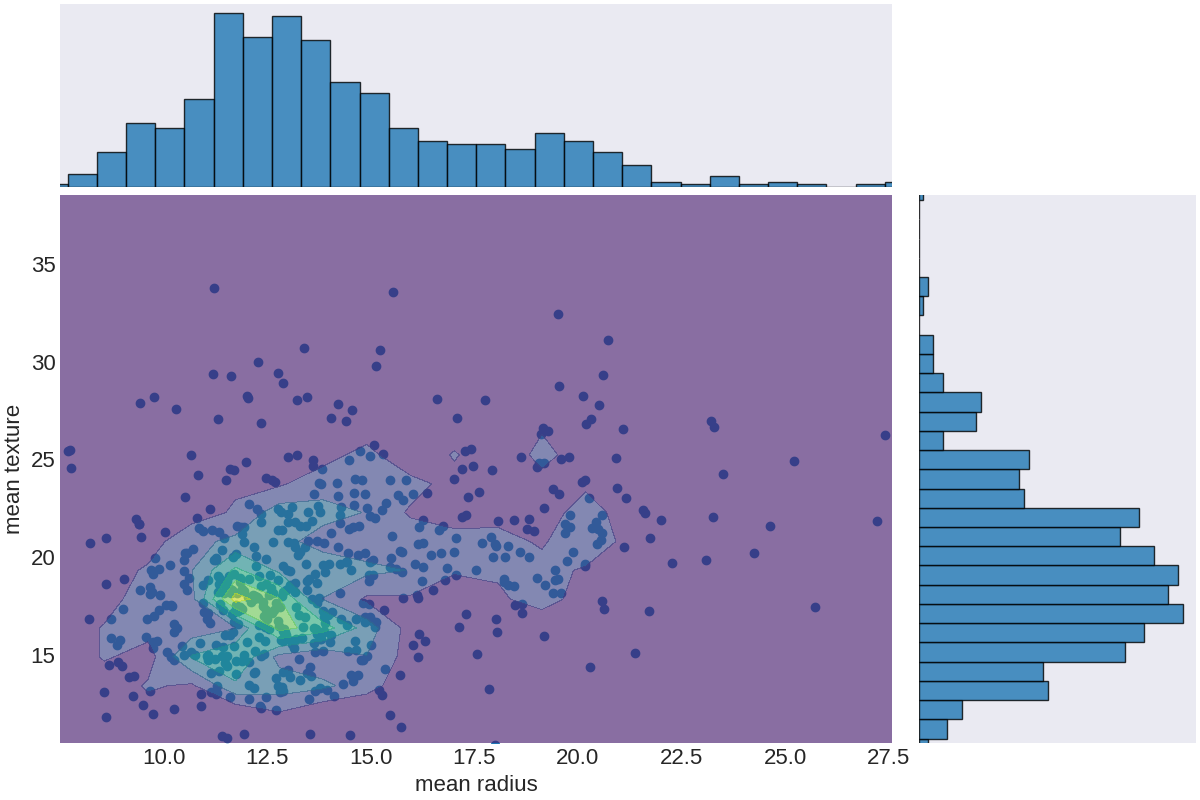
Generating histograms (2D)
This will generate at 2D histogram of the selected variables and also display the two corresponding 1D histograms.
from matplotlib import pyplot as plt
import pandas as pd
from sklearn.datasets import load_breast_cancer
from psynlig import histogram2d
plt.style.use('seaborn-dark')
plt.rcParams.update({'font.size': 16})


data_set = load_breast_cancer()
data = pd.DataFrame(data_set['data'], columns=data_set['feature_names'])

xvar = 'mean radius'
yvar = 'mean texture'

kwargs = {
    'histogram2d': {
        'alpha': 0.3,
        'bins': 20,
        'density': True
    },
    'histogram1d': {
        'alpha': 0.8,
        'edgecolor': 'black',
        'bins': 30,
        'density': True
    },
    'scatter': {
        's': 50,
        'alpha': 0.9,
        'marker': 'o',
        'color': '0.7',
        'edgecolors': 'black',
    },
    'contour': {
        'alpha': 0.6,
        'cmap': 'viridis',
    },
    'figure': {
        'figsize': (12, 8),
    },
}

histogram2d(
    data,
    xvar,
    yvar,
    class_data=None,
    class_names=None,
    show_hist=False,
    show_contour='filled',
    show_scatter=True,
    **kwargs,
)

plt.show()
Total running time of the script: ( 0 minutes 0.508 seconds)