Note
Go to the end to download the full example code
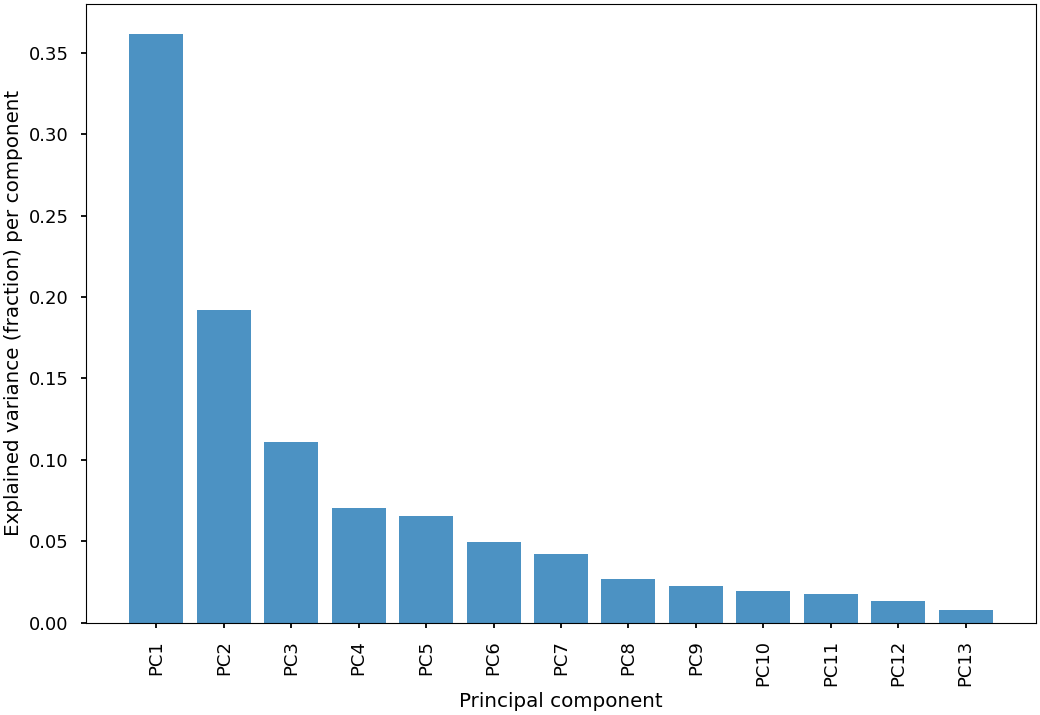
Explained variance (bar plot)
This example will show the explained variance from a principal component analysis as a function of the number of principal components considered.
from matplotlib import pyplot as plt
import pandas as pd
from sklearn.datasets import load_wine
from sklearn.preprocessing import scale
from sklearn.decomposition import PCA
from psynlig import pca_explained_variance_bar
plt.style.use('seaborn-talk')

data_set = load_wine()
data = pd.DataFrame(data_set['data'], columns=data_set['feature_names'])
data = scale(data)

pca = PCA()
pca.fit_transform(data)

pca_explained_variance_bar(pca, alpha=0.8)

plt.show()
Total running time of the script: ( 0 minutes 0.241 seconds)