Note
Go to the end to download the full example code
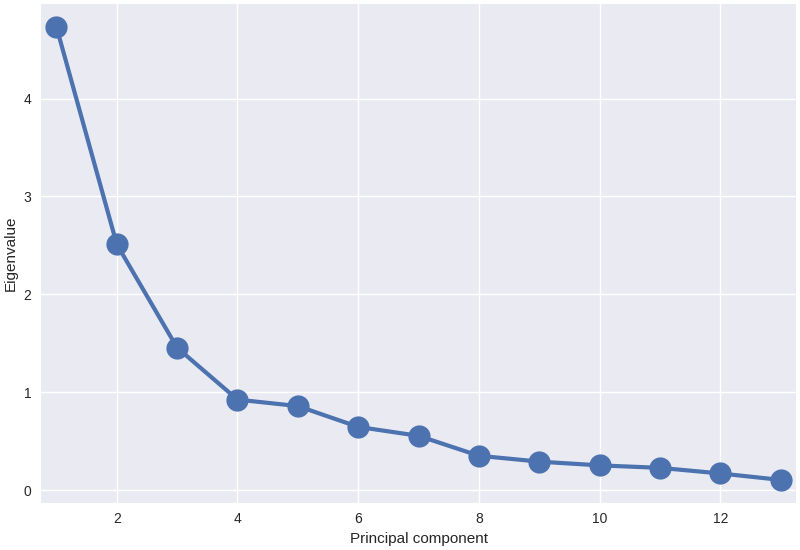
Scree plot
This example will show the eigenvalues of principal components from a principal component analysis.
from matplotlib import pyplot as plt
import pandas as pd
from sklearn.datasets import load_wine
from sklearn.preprocessing import scale
from sklearn.decomposition import PCA
from psynlig import pca_scree
plt.style.use('seaborn')
plt.rcParams.update({'font.size': 16})

data_set = load_wine()
data = pd.DataFrame(data_set['data'], columns=data_set['feature_names'])
data = scale(data)

pca = PCA()
pca.fit_transform(data)

pca_scree(pca, marker='o', markersize=16, lw=3)

plt.show()
Total running time of the script: ( 0 minutes 0.194 seconds)